· The Bloomfield Team
What a Production Dashboard Should Actually Show
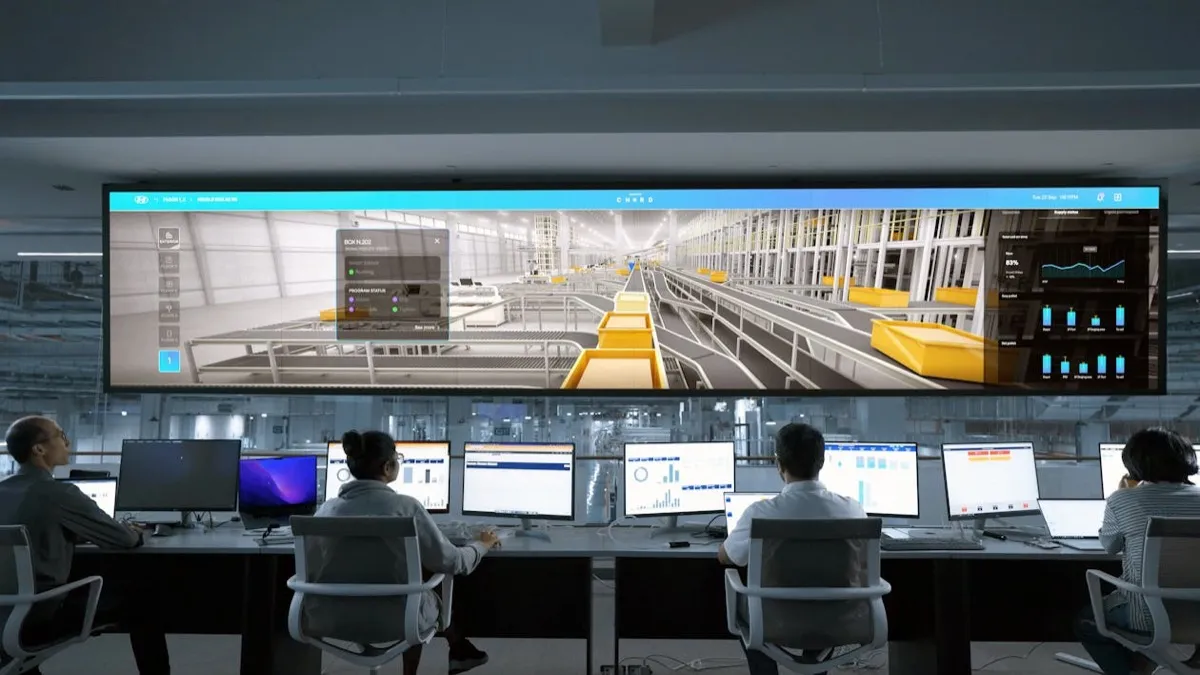
There is a 65-inch TV on the wall outside the production manager's office at a 55-person stamping shop in Tennessee. Machine utilization percentages for each press, updated every 15 minutes. Green above 80%. Yellow 60 to 80%. Red below 60%. Most days, the screen is green with a few yellows.
The production manager calls it "wallpaper." Nobody changes their behavior based on what it shows. A press running at 73% versus 82% does not trigger a single different decision from anyone on the floor.
This is the standard outcome for production dashboards in manufacturing. The shop buys the hardware, the software, the data connections. The TV goes on the wall. Three months later, it is scenery. The failure is in what the dashboard displays: metrics that describe activity without revealing the decisions that need to be made.
The Problem With Activity Metrics
Machine utilization, parts per hour, OEE, uptime percentage. Standard dashboard fare. They answer one question: "How busy are we?" They do not answer the question that matters: "Are we going to ship everything on time this week, and if not, what needs to change right now?"
A machine at 92% utilization is busy. That tells you nothing about whether the job running on it is the right job given the ship dates of everything else in the queue. A press could run at 95% utilization all week on work that is not due for three weeks while Friday's orders sit waiting. The utilization number looks great. Delivery performance is about to crater.
For a deeper look at how these ideas connect across the shop floor, see our guide to production visibility.
Parts per hour tells you the rate. It does not tell you whether that rate will finish the job in time for the next operation, or whether the parts coming off the machine will pass inspection. A cell producing 40 parts per hour with a 6% scrap rate is not performing nearly as well as the hourly number suggests.
OEE combines availability, performance, and quality into a single number. Useful for long-term equipment analysis. Nearly useless for daily decisions because it obscures the specific factors a production manager can act on in the moment. An OEE of 72% tells nobody what to do next.
What Decisions Need to Be Made
A useful production dashboard starts with the decisions it needs to support, then works backward to the data those decisions require.
The production manager at a job shop makes a limited number of recurring decisions each day. Every morning, they need to answer these questions:
- Which jobs are at risk of shipping late, and what is causing the risk?
- Which work centers have the most schedule pressure this week?
- Are there any jobs waiting to start that are blocked by material, tooling, programming, or a prior operation?
- Did anything happen on the previous shift that changes today's priorities?
- Which jobs currently running are behind their estimated pace?
These five questions drive 90% of the production manager's daily decisions. A dashboard that answers them clearly and accurately is useful. A dashboard that shows utilization percentages is not.
The First Layer: At-Risk Jobs
The most valuable element on any production dashboard is a list of jobs ranked by delivery risk. Risk calculated by comparing remaining work against available time before the ship date, factoring in work center capacity and known constraints: missing material, quality holds, machine availability.
A job with 20 hours of remaining work, one week to ship, and an open path through available machines is low risk. A job with 20 hours of remaining work, two days to ship, and a machine queue already full for both days is in trouble. The dashboard should make this obvious: these five jobs need attention, and here is specifically why.
For each at-risk job, show the bottleneck. Waiting for material? Show the expected arrival date. Queued behind three other jobs? Show estimated wait time. On quality hold? Show the nonconformance and the action needed to release it. The production manager needs the problem and the path to resolution in a single view.
This requires data from multiple sources: ERP for job status and due dates, scheduling for machine queues, purchasing for material delivery dates, quality system for open holds. Connecting these sources is the prerequisite for a useful dashboard.
The Second Layer: Work Center Load
Below the at-risk job list, the dashboard should show a capacity view by work center for the current week and next week. This view shows how many hours of work are scheduled against each machine or cell versus how many hours of capacity are available.
A work center with 45 hours of work scheduled against 40 hours of capacity is overloaded. The dashboard should flag this and show which jobs are contributing to the overload, ranked by priority. The production manager can then decide which job to move to an alternate machine, which to push to next week, or which to expedite by running overtime.
A work center with 20 hours of work against 40 hours of capacity has open time. The dashboard should show whether any at-risk jobs from other work centers could be routed there. In a shop with multiple machines capable of running similar work, this rebalancing decision happens informally every day. Making it data-driven instead of intuitive means it happens faster and catches opportunities that the informal process misses.
The Third Layer: Blocked Jobs
Every job shop has work-in-process sitting on the floor waiting for something. Waiting for material. Waiting for an open machine. Waiting for tooling. Waiting for a first-article approval. Waiting for a drawing revision from the customer. This waiting time is invisible in most ERP systems because the job shows as "in process" from the moment it is released until it ships.
The dashboard should show every job that is currently blocked, what it is blocked by, and how long it has been waiting. A job that has been waiting for material for five days is a different problem than a job that has been waiting for first-article approval for two hours. Both are blocked, but the urgency and the responsible party are different.
Displaying blocked jobs creates accountability. When the dashboard shows that three jobs have been waiting for tooling for more than 24 hours, the tooling manager sees it. When two jobs are waiting for a customer-approved first article, the quality manager or the sales team can follow up. The information was always available in theory, buried across multiple systems and people's memories. The dashboard makes it visible to everyone simultaneously.
The Fourth Layer: Pace Versus Plan
For jobs that are currently running, the dashboard should show whether the actual production rate matches the estimated rate. If a job was quoted at 3 minutes per part and the actual pace is 4.5 minutes per part, the job will take 50% longer than planned. That overage has a direct impact on the schedule for every job behind it in the queue.
Real-time pace tracking requires some form of data collection from the floor, either from machine monitoring (MTConnect, OPC-UA, or simple cycle counters), from operator input at the work station, or from barcode scanning at operation completion. The method depends on the shop's equipment and workflow. The output is the same: a comparison of actual versus estimated pace that flags deviations before they cascade into delivery problems.
A job running 15% behind pace with two days remaining before its ship date is a different conversation than a job running 15% behind pace with two weeks remaining. The dashboard should present both the deviation and the context, so the production manager can prioritize which pace problems to address and which to absorb.
What Does Not Belong on the Dashboard
Removing clutter is as important as adding useful information. A dashboard that shows twenty metrics invites the same wallpaper effect as a dashboard that shows one useless metric. The screen has limited real estate. Every element should correspond to a decision someone needs to make today.
Machine utilization percentages can go. They are useful in monthly reports for capacity planning. They are not useful for daily decision-making. Revenue figures can go. They belong in accounting, not on the shop floor. Monthly OTD numbers can go. The at-risk job list shows the leading indicator; the monthly OTD is the trailing result.
The test for whether a metric belongs on the production dashboard: if this number changed by 10% right now, would someone on the floor do something differently in the next four hours? If the answer is no, the metric belongs in a report, not on the wall.
Building the Dashboard That Works
A useful production dashboard requires three things. Data from multiple systems connected into a single source. Logic that transforms raw data into decision-relevant information: the risk calculation that turns job status plus due date plus machine availability into a priority ranking. And a display built for the audience, which on a shop floor TV means large text, clear color coding, no more than four or five items visible at a glance, with drill-down on a tablet or workstation.
The custom tools we build at Bloomfield start with the decisions your production team makes and work backward to the data and logic required. The result is a dashboard people use because it shows what needs attention right now. What is at risk. What is blocked. What needs to change in the next shift.
The 65-inch TV on the wall can be useful. That depends entirely on what is on the screen.
Related Field Notes
Build a dashboard your team will actually use
We will map your production decision-making process and design a dashboard around the information that drives those decisions.
Talk to Our Team →